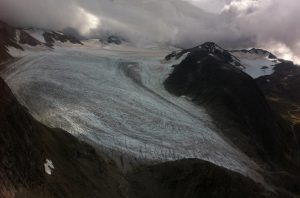
Lemon Creek Glacier in 2014
Abstract
Annual balance measurements on the Lemon Creek Glacier, Alaska conducted by the Juneau Icefield Research Program from 1953 to 2017 provide a continuous 65 year record. This is a World Glacier Monitoring Service reference glacier. In 2016 the USGS has begun monitoring the mass balance of this glacier and will take over from JIRP the reporting of mass balance. This is one of the nine American glaciers selected in a global monitoring network during the IGY, 1957-58. These data have been acquired primarily by employing consistent field methods, conducted on similar annual dates and calculated using a consistent methodology.
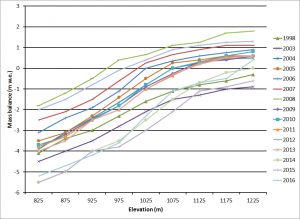
Lemon Creek Glacier, Alaska was chosen as a representative glacier for the 1958 IGY global glacier network. This choice was based on its sub-arctic latitude and on the ongoing mass balance program of (JIRP) that had begun in 1948 (Miller, 1972; Pelto and Miller, 1990). JIRP has continued annual balance measurements on Lemon Creek Glacier through the present (Fig. 2). In 1957 Lemon Creek Glacier was 6.4 km long and had an area of 12.67 km2. In 1998 the glacier was 5.6 km long and had an area of 11.8 km2 (Marcus et al., 1995). From the head of the glacier at 1450 m to the mean ELA at 1050-1100 m the glacier flows northward, in the ablation zone the glacier turns westward terminating at 600 m. The glacier can be divided into four sections: 1) Steep peripheral northern and western margins draining into the main valley portion of the glacier. 2) A low slope (40) upper accumulation zone from 1220 m to 1050 m. 3) A steeper section (60) in the ablation zone as the glacier turns west from 1050-850 m. 4) An icefall (180) leading to the two fingered termini at 600 m. The maximum thickness exceeding 200 m is 1 km above the icefall (Miller, 1972). Lemon Creek Glacier has retreated 1200 m since 1948 and 800 m since 1957, and has retreated an average of 10–13 m a-1 between 1998 and 2009 (Pelto et al 2013).
On Lemon Creek Glacier the mass balance record determined from field measurements yields a cumulative mass balance of –26.9 m from 1953-2011 (Pelto et al 2013). The annual balance record of -12.7 m we (13.9 m of ice thickness) from 1957-1989 compares well to the thinning identified from geodetic methods of 1957-1989 of -13.2 (Marcus and others, 1995). The annual balance record of –17.1 m we (-19.0 m of ice thickness) from 1957-1995 compared to an observed ice thickness of -16.4 m (Sapiano et al, 1998). Airborne surface profiling by the University of Alaska-Fairbanks (Sapiano et al., 1998; Larsen et al, 2007) noted an additional -13.1 m surface elevation change, compared to a surface mass balance of -10 m from 1995-2007. The error in both geodetic programs is less than 1.5 m. In each of the three time intervals using two different ice thickness assessment techniques the annual balance record is confirmed.
To refine the reliability of density determinations in this data set the effects of internal accumulation from refrozen meltwater producing diagenetic ice structures in the annual firnpack have been taken in to account. An unusual dearth of such structures with the 1997-1998 firnpack provided a unique opportunity to facilitate application for he providing technique over broad areas of the neve. This added top our ground truth and verified accuracy of the testpit measurements used in these long-term mass balance computations.
This negative mass balance has fueled a terminal retreat of 1200 m since 1948. The annual balance trend indicates that despite a higher mean elevation and a higher elevation terminus, from thinning and retreat, mean annual balance has been strongly negative since 1977 (-0.78 m/a).
Published as: Maynard M. Miller and Mauri S. Pelto. Mass balance measurements on the Lemon Creek Glacier, Juneau Icefield Alaska 1953-1998.. Geogr Ann. 81, 671-681.
Introduction
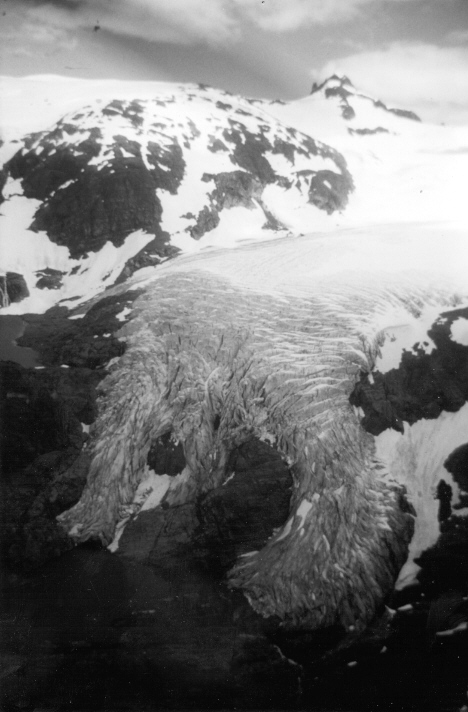
Lemon Creek Glacier, Alaska was chosen as a representative glacier for the 1958 IGY global glacier network (Figure 1). This choice was based on its sub-arctic latitude location and on the ongoing mass balance program of the Juneau Icefield Research Program (JIRP), that had begun in 1948 (Miller, 1972, p. 4-6; Pelto and Miller, 1990, p. 121). JIRP has continued annual balance measurements on Lemon Creek Glacier through 1998. Based on 1955-57 vertical aerial photography a 1:10,000 scale map was produced in 1958 for the IGY (Heusser and Marcus, 1964, Fig. 3). In 1957 Lemon Creek Glacier was 6.4 km long and had an area of 12.67 km2 (Figure 2)(Heusser and Marcus, 1964, p. 63). In 1998 the glacier was 5.6 km long and had an area of 11.8 km2 (Figure 3) (Marcus et al., 1995, Fig. 6). From the head of the glacier at 1300 m to the mean ELA at 1050-1100 m the glacier flows northward, in the ablation zone the glacier turns westward terminating at 600 m. The glacier can be divided into four sections: 1) Steep peripheral northern and western margins draining into the main valley portion of the glacier. 2) A low slope ( 40) upper accumulation zone from 1220 m to 1050 m. 3) A steeper section (60) in the ablation zone as the glacier turns west from 1050-850 m. 4) An icefall (180) leading to the two fingered termini at 600 m. The maximum thickness exceeding 200 m is 1 km above the icefall (Figure 4)(Thiel, 1957, p. 746; Miller, 1972, Fig. 74-77).
This paper will review the compilation of the 46 year mass balance record for this glacier (1953-1998). Only cursory mass balance observations were made from 1948-1952. On Lemon Creek Glacier no early ablation season or late accumulation season measurements are made, thus, summer and winter balance cannot be separated. The only previous publication of annual balance are for the 1954-1958 period (Heusser and Marcus, 1964; p. 69). The annual balance record has been verified using geodetic methods based on a comparison of the1:10,000 scale maps made of the glacier in 1957 and in 1989 (Marcus and others, 1995: p. 155). Further surface radar altimetry using airborne surface profiling has documented the geodetic mass balance change from 1989 to 1995 (Sapiano et al; 1998, Table 5). In 1996-1998 comparative GPS surface profiling has further updated the surface elevation change. Without these geodetic measurements the error of annual balance measurement using stratigraphic methods is difficult to assess, especially in view of the dearth of detailed terminus area ablation measurements.
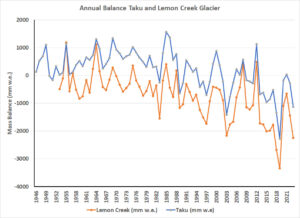
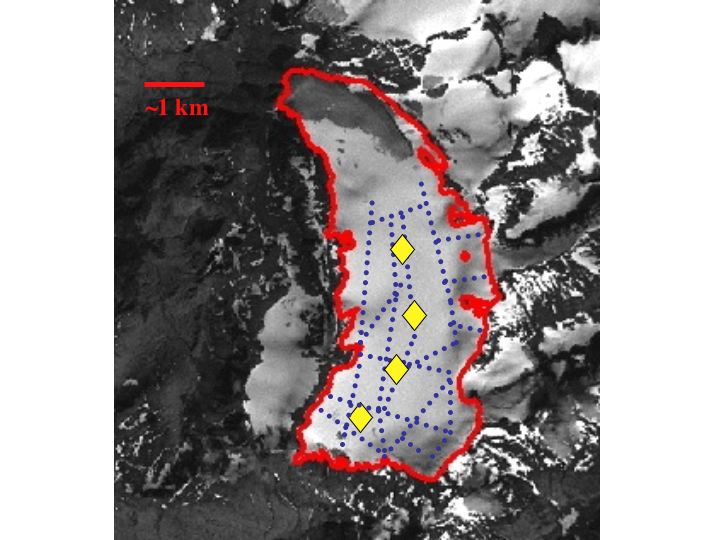 Figure 5: Measurements sites of mass balance on Lemon Creek Glacier in 1984 and 1998.
Mass Balance Methods
Each year the mass balance of Lemon Creek Glacier has been determined using stratigraphic field measurements of varying distribution and number. At a minimum each year the field studies comprise repeated transient snowline mapping in early July and the ELA in early September, and net retained accumulation measurements at four mass balance control sites (Figure 5).
Each year JIRP completes between July 10 and July 20 a series of testpits in which the thickness and density of the previous winters retained accumulation is measured. A continuous density profile from the surface to the base of the annual firnpack provides a direct measure of the annual water equivalent thickness (LaChapelle, 1954, p. 19-21). The base of the annual accumulation increment is identified by a continuous dusty horizon formed on the previous summer surface. This layer is well developed during each ablation season on the Lemon Creek Glacier (LaChapelle, 1954, p. 25). LaChapelle (1954, p.24) noted that one of the first characteristics which becomes apparent upon examination of the testpit profiles is the remarkable uniformity of firn density in vertical profile, and in distribution over the glacier, and with time during the summer. The average bulk density is determined each year, and has ranged from 0.54-0.58 Mg/m3, including diagenetic ice (0.54-0.55 Mg/m3in 1998).
In addition to the four standard sites, net annual retained accumulation thickness has been observed at up to 300 points in a single summer season. These additional measurements above the transient snowline have been rammsonde profiles, and by crevasse stratigraphy in transects starting near the standard testpit sites or the transient snowline.
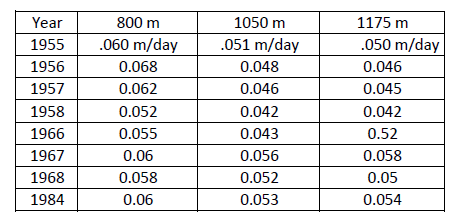
Ablation stakes, driven into the firn in the accumulation zone record the ablation of the remaining firnpack in the accumulation zone between the testpit accumulation measurements in July and the end of the ablation season in early September. This provides an essential measure to adjust the July accumulation thickness testpit measurements to the end of the ablation season. The maximum number of such ablation stakes used during a single season was 200 in 1967. During the several years where more than 30 ablation stakes were emplaced, it is apparent that ablation rates above 900 m are nearly constant on the Lemon Creek Glacier. Below 900 m ablation rates increases with decreasing surface elevation. Table 1 includes the mean ablation rate determined from stake ablation at locations used during different ablation seasons, in particular this table illustrates the similarity of ablation above the icefall at 900 m from July through early September.
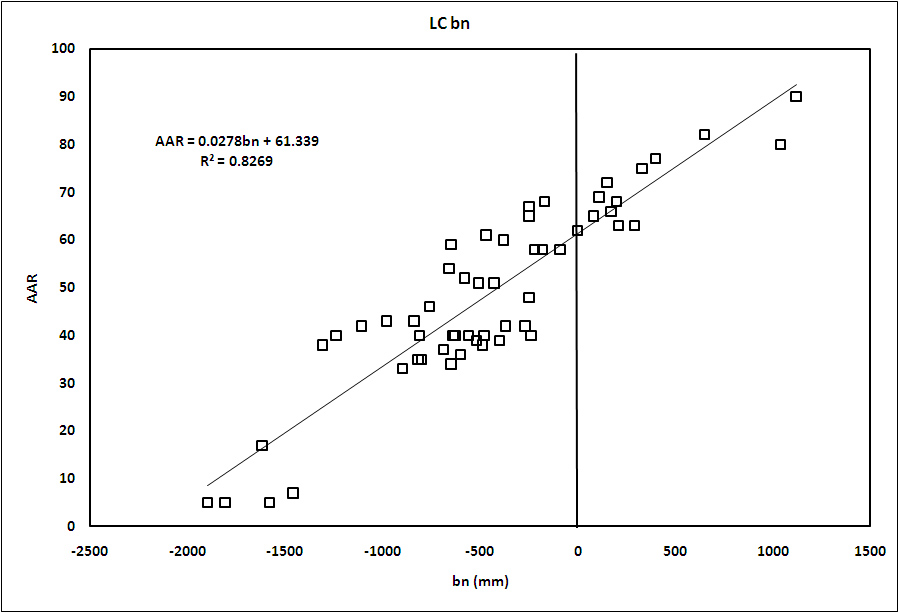
The transient snowline position is mapped in early July and the ELA in early September to provide a further check on the amount of ablation. The ELA provides a crucial tie point for the glacier’s annual balance determination. The calculation of annual balance for each year depends on extrapolations from the standard testpit sites and ELA, based on the detailed mass balance measurements made across the glacier from 1954-1957, 1965-1969, 1972-1975, 1982-1984, and 1998. Except for the years from 1954-1957 with mass balance calculated by Heusser and Marcus (1964, p. 69), annual balance is determined using data from the same five data points, four testpits and the ELA.
JIRP has used consistent field methods on similar dates to provide comparable records for each year. Meier and Walters (1989, p.367) noted that glacier mass balance can be determined using area-weighted data from a single observation point. This can be done only after the weights for data points have been determined from in-depth multi-year mass balance studies, and calculations made of the representative area for each point. This method using typically 3-5 standard measurement points is employed by the USGS on their benchmark glaciers Gulkana, Wolverine and South Cascade Glacier (Krimmel, 1994, Fig. 1; Mayo and Trabant, 1992, Fig. 1; March and Trabant, 1995, Fig. 1). We have applied a comparable density of measurements on Lemon Creek Glacier.
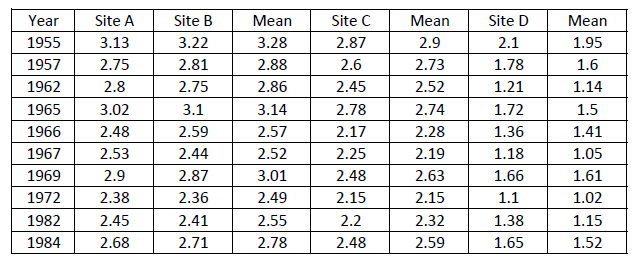
A detailed map of the accumulation pattern on the Lemon Creek Glacier has been made from accumulation measurements made at several hundred locations during some summers both in July and August. Table 2 indicates that indeed the pattern is consistent and provides an accurate assessment of mass balance. In 1998, 300 accumulation measurements were made to supplement the control record from the standard testpits. The pattern of mass balance remained the same despite glacier thinning and the notably negative balance to the pattern observed in 1954, 1960, 1967, 1972, 1978 and 1984 (Figure 6).
Ablation measurements in the ablation zone (region below the July transient snowline) are the largest source of error. Although extensive ablation stake arrays have been used in some years, this has not been possible in others. Based on 11 years of extensive ablation zone ablation measurements the distribution of ablation in years of incomplete records for specific July 1 transient snowlines and September ELA’s has been estimated. It has been observed that seasonal ablation above the transient snowline is nearly uniform, while ablation in the ablation zone is not. The July 1 transient snowline sector best represents early season ablation and the change in elevation to the early September ELA sector is the best measure of ablation for the remainder of the ablation season.
Total annual ablation is calculated from the summer season rise in the transient snowline between early July and September. This is based on the observed firnpack water equivalence in early July in the zone where the ELA is later observed to be in September. The specific ablation between July and early September at that location, thus references the entire ablation zone, using measured summer ablation data from the years listed in Table 1. This method assumes the pattern of ablation across the glacier in the ablation zone to be similar from year to year, and that the relationship to ablation in the accumulation zone is consistent. The data in Table 1 supports this consistency in ablation in the accumulation zone 4.
The relationship between net accumulation zone ablation and ablation zone ablation has also been observed during at least 7 summer seasons. This points at accumulation zone ablation for the summer months as an additional indicator of ablation zone ablation.
Values of mass balance recorded at the four principal testpit sites and the change in transient snowline are weighted for the respective altitude zone of the glacier that each represents. The mean value for each elevation zone and each site value has been determined. The site value divided by the mean value yields the weight for each site. These values are shown in Table 2. Mass balance control site A and B are used to determine the mean annual accumulation for the upper section of the glacier above 1175 m. Site C represents the mean accumulation area for the glacier from 1100-1175 m, Site D represents the mean for the elevation zone from 1025-1100 m. The transient snowline altitude change from early July to September is used to determine the mean ablation rate for the ablation zone. It is axiomatic that the mass balance is then the sum of the products of the area and mean annual balance of each area-elevation zone.
The surface area for each elevation band has been determined from the 1:10,000 surface map of 1957, with the same areas applied up to 1977. From 1977 to 1998 the surface areas of the 1989 topographic map has been used. The changes in area of all but the lowest elevation band were less than 1%. Terminus area changes mapped in 1965 have been used for the lower elevation band area for the 1965-1977 period.
Mass Balance Record
The mass balance record determined solely from field measurements (Table 3), yields an overall mass balance of –22.1 m from 1953-1998. This represents a significant thinning of the glacier over the 46 year interval. With an estimated volume of 901.7 million m3, the loss determined up to 1989 of -131.9 million m3 was 15% of the total glacier volume (Marcus and others, 1995: p. 159). This geodetic determination of long-term 1954-1989 mass balance change, represented a 13.2 m change in mean glacier thickness. Airborne surface profiling (Sapiano et al., 1998: Table 5) noted an additional loss of 3.2 m of glacier surface elevation from 1989 to 1995. Comparative GPS surface profiling in 1996-1998 indicated an additional
– 4.6 m of glacier surface change. The annual balance record of -12.7 m we (13.9 m of ice thickness) from 1957-1989 compares well to the thinning identified from geodetic methods of 1957-1989 of -13.2 (Marcus and others, 1995, p. 159). The annual balance record of –17.1 m we (-19.0 m of ice thickness) from 1957-1995 also matches well the airborne surface profiling 1957-1995 change of -16.4 m (Sapiano et al, 1998, Table 5 and Fig. 2). This flight was made in late June when ice thickness was 1-2 m greater on average than at the end of the 1995 field season. The error in both geodetic programs is less than 1.5 m. Table 4 illustrates overall glacier mass balance changes determined by the three different means: airborne surface profiling, surface mapping, and field measurements.
The annual balance record indicates that from 1957-1976 mass balance loss was –0.23 m/a and thinning was modest on the upper reaches of the glacier. Despite a higher mean elevation and a higher terminus elevation due to glacier retreat, mean annual balance has been increasingly negative since 1977, averaging -0.78 m/a. The record is particularly negative since 1990, -1.04 m/a (Figure 6). In 1996 and 1997, no accumulation was retained on Lemon Creek Glacier for the first time since observations were initiated in 1948. In 1998, a small patch of accumulation was retained on the upper part of Observation Peak at the head of the glacier basin, covering less than 1% of the entire accumulation area. The ELA has risen above the glacier’s neve each of the last three years.
Annual Balance Errors
JIRP recognizes that Lemon Creek Glacier annual balance measurement program has gaps in its record due to logistical and time restrictions that lead to some interpretation errors. The ongoing goal is to minimize such and to continue to enhance the record reliability. For example, potential errors in accumulation measurement occur when meltwater percolates through the current annual firn increment and refreezes within a lower firn increment. This internal accumulation (Trabant and Mayo, 1985, p. 114), is not measured in most mass balance programs. Bazhev (1986, p. 168-169) noted that while most meltwater that refreezes does so in the current annual increment some does percolate beyond into previous firn increments. This recaptured meltwater occurs as meltwater refrozen in diagenetic ice structures. This ice and all internal accumulation develops prior to the snowpack becoming totally isothermal at 0oC. On Lemon Creek glacier this occurs prior to July 1 (Miller, 1972, p. 35; Miller, 1955, p.292). Thus, internal accumulation does not occur after July 1 and ablation measurements are representative of summer ablation losses.
To determine how much meltwater is retained as diagenetic structures the walls of the testpit are surveyed. Crevasse stratigraphy has been useful source of this information in 1982 and 1984. The total water equivalent of the three most recent annual firn layers are checked in early July, early August and the following July. In each of these years the 1 and 2 year old increments experienced a net gain of 1-2% water equivalent, suggesting minor internal accumulation that is not accounted for when sampling only the most recent accumulation layer. This procedure can be repeated in the future for more accurate measurement of this increase. In most cases internal accumulation below the most recent annual increment is viewed as negligible.
Another potential error involves the assessment of ablation in the ablation zone, which is based on correlation with ablation measured at the transient snowline (Table 2). Errors may be expected in years in which the ablation pattern is atypical. The relationship of transient snowline changes to observed surface ablation above the ELA is the only potential check on this, albeit an indirect measure.
On Lemon Creek Glacier, ablation during several summers in the accumulation zone has been noted at extensive arrays of stakes during several summers. The standard deviation in surface ablation was found to be less than 0.05m/month, which gives support to the use of ablation stakes and the ELA to adjust the July firn depth.
The most serious error to be considered derive from completing annual balance measurements considerably before the end of the true ablation season, when possible annual balance has been observed and recorded at the end of the ablation season in several years. Ablation is severely reduced after August 25, thus, when the ELA measurement can be made early September it provides an acceptable measure of the final position.
Conclusion
The annual balance record of the Lemon Creek Glacier extends over 46 years showing an increasingly negative trend in annual balance. The total loss is substantial with a net thinning of 24.4 m. This record has been obtained from a consistent set of yearly measurements using comparable methods and at similar annual dates. The result is a record in which we have confidence, though it is not precise. Moreover, comparison with long term geodetic mass balance determinations from two different measurement methods demonstrate, that this annual balance record is acceptably reliable. Specific winter and summer balances of course cannot be differentiated from this record.
The lesson of this documentation is that mass balance measurements with a limited annual density of coverage can still be reliable if there is: 1) An independent check using surface remapping, airborne profiling and/or GPS surface leveling: 2) A program of extensive supplementary measurements during at least some years to refine mass balance patterns and likely errors.
Identification of errors and the refinement of mass balance patterns are an ongoing process that can be used to reassess mass balance records. In 1998 JIRP completed a more detailed mass balance assessment of Lemon Creek Glacier examining accumulation at more than 300 locations. This data set helps to continue refinement of the mass balance pattern. Also of importance in 1998 was the lack of development of diagenetic ice for the second consecutive year. This is an indication that the spring snowpack was not cold enough to lead to substantial refreezing of meltwater. This is important information regarding the 1998 mass balance, because 7-11% of the retained annual accumulation is typically diagenetic ice. Failure to retain this meltwater increases net ablation. The reason for the warmer snowpack was that winter temperatures were +4oC above the long term mean at the Juneau Airport seven miles from the glacier at sea level. At Camp 17 at 1300 m on the edge of the Lemon Creek Glacier’s neve, mean March and April, 1998 temperatures averaged -5oC, to warm to keep the snowpack below 0oC. The result of the failure to recapture meltwater as internal accumulation is increased ablation and negative annual balances on Lemon Creek Glacier.
Acknowledgements
The support of NSF, NASA, U.S. Army Research Office, the Murdock Charitable Trust and University of Idaho have been essential to this project, as well as the Foundation for Glacier and Environmental Research, Pacific Science Center, Seattle, WA.
| Year | LC ELA | LC bn | lc bn | Taku ELA | Taku bn | Taku bn | LC AAR | Taku AAR |
| 1946 | 980 | -0.04 | -40 | 85 | ||||
| 1947 | 900 | 0.36 | 360 | 88 | ||||
| 1948 | 870 | 0.51 | 510 | 89 | ||||
| 1949 | 800 | 0.93 | 930 | 90 | ||||
| 1950 | 1010 | -0.18 | -180 | 84 | ||||
| 1951 | 1160 | -0.34 | -340 | 68 | ||||
| 1952 | 950 | 0.16 | 160 | 86 | ||||
| 1953 | 1080 | -0.56 | -560 | 1010 | -0.15 | -150 | 40 | 84 |
| 1954 | 1025 | -0.18 | -180 | 1160 | -0.07 | -70 | 58 | 68 |
| 1955 | 810 | 1.12 | 1120 | 950 | 0.97 | 970 | 90 | 86 |
| 1956 | 1075 | -0.64 | -640 | 1010 | -0.13 | -130 | 40 | 84 |
| 1957 | 1000 | 0 | 0 | 980 | -0.04 | -40 | 62 | 85 |
| 1958 | 1040 | -0.58 | -580 | 780 | 0.21 | 210 | 52 | 91 |
| 1959 | 1150 | -0.9 | -900 | 1000 | 0.35 | 350 | 33 | 84 |
| 1960 | 1130 | -0.82 | -820 | 1010 | 0.16 | 160 | 35 | 84 |
| 1961 | 1080 | -0.24 | -240 | 930 | 0.48 | 480 | 40 | 87 |
| 1962 | 1110 | -0.69 | -690 | 915 | 0.39 | 390 | 37 | 88 |
| 1963 | 970 | 0.17 | 170 | 950 | 0.57 | 570 | 66 | 86 |
| 1964 | 885 | 1.04 | 1040 | 885 | 1.13 | 1130 | 80 | 90 |
| 1965 | 980 | 0.08 | 80 | 900 | 0.79 | 790 | 65 | 90 |
| 1966 | 1100 | -0.49 | -490 | 875 | 0.08 | 80 | 38 | 89 |
| 1967 | 1130 | -0.6 | -600 | 750 | 0.25 | 250 | 36 | 91 |
| 1968 | 1060 | -0.22 | -220 | 810 | 0.46 | 460 | 58 | 90 |
| 1969 | 1000 | 0.21 | 210 | 965 | 1.17 | 1170 | 63 | 86 |
| 1970 | 1060 | -0.09 | -90 | 930 | 0.76 | 760 | 58 | 91 |
| 1971 | 1110 | -0.4 | -400 | 885 | 0.63 | 630 | 39 | 88 |
| 1972 | 1140 | -0.65 | -650 | 730 | 0.42 | 420 | 34 | 92 |
| 1973 | 1110 | -0.52 | -520 | 825 | 0.52 | 520 | 39 | 90 |
| 1974 | 1090 | -0.37 | -370 | 850 | 0.58 | 580 | 42 | 89 |
| 1975 | 1010 | 0.29 | 290 | 800 | 0.85 | 850 | 63 | 90 |
| 1976 | 1080 | -0.25 | -250 | 850 | 0.66 | 660 | 48 | 89 |
| 1977 | 1110 | -0.48 | -480 | 885 | 0.47 | 470 | 40 | 88 |
| 1978 | 1150 | -0.8 | -800 | 915 | 0.31 | 310 | 35 | 87 |
| 1979 | 1110 | -0.63 | -630 | 950 | 0.14 | 140 | 40 | 86 |
| 1980 | 1100 | -0.27 | -270 | 870 | 0.54 | 540 | 42 | 89 |
| 1981 | 1120 | -0.81 | -810 | 980 | 0.12 | 120 | 40 | 85 |
| 1982 | 1070 | -0.43 | -430 | 950 | 0.15 | 150 | 51 | 86 |
| 1983 | 1220 | -1.62 | -1620 | 1085 | -0.42 | -420 | 17 | 79 |
| 1984 | 1010 | -0.25 | -250 | 875 | 0.64 | 640 | 65 | 89 |
| 1985 | 965 | 0.33 | 330 | 600 | 1.4 | 1400 | 75 | 93 |
| 1986 | 1070 | -0.51 | -510 | 720 | 1.2 | 1200 | 51 | 92 |
| 1987 | 1100 | -0.84 | -840 | 910 | 0.39 | 390 | 43 | 88 |
| 1988 | 1000 | 0.11 | 110 | 890 | 0.6 | 600 | 69 | 88 |
| 1989 | 1130 | -1.24 | -1240 | 1115 | -0.81 | -810 | 40 | 74 |
| 1990 | 1125 | -1.11 | -1110 | 1080 | -0.45 | -450 | 42 | 79 |
| 1991 | 1050 | -0.38 | -380 | 900 | 0.38 | 380 | 60 | 88 |
| 1992 | 1075 | -0.66 | -660 | 940 | 0.17 | 170 | 54 | 86 |
| 1993 | 1130 | -0.98 | -980 | 980 | -0.04 | -40 | 43 | 85 |
| 1994 | 1100 | -0.76 | -760 | 970 | 0.09 | 90 | 46 | 85 |
| 1995 | 1150 | -1.31 | -1310 | 1050 | -0.76 | -760 | 38 | 81 |
| 1996 | 1370 | -1.58 | -1580 | 1150 | -0.96 | -960 | 5 | 68 |
| 1997 | 1400 | -1.81 | -1810 | 1225 | -1.34 | -1340 | 5 | 60 |
| 1998 | 1300 | -1.46 | -1460 | 1120 | -0.98 | -980 | 7 | 73 |
| 1999 | 1020 | 0.2 | 200 | 900 | 0.4 | 400 | 68 | 88 |
| 2000 | 900 | 0.65 | 650 | 750 | 1.03 | 1030 | 82 | 91 |
| 2001 | 950 | 0.4 | 400 | 850 | 0.88 | 880 | 77 | 89 |
| 2002 | 1025 | -0.25 | -250 | 975 | 0.1 | 100 | 67 | 88 |
| 2003 | 1400 | -1.9 | -1900 | 1100 | -0.9 | -900 | 5 | 77 |
| 2004 | 1150 | -1.25 | -1250 | 1100 | -0.83 | -830 | 59 | 86 |
| 2005 | 1050 | -0.47 | -470 | 1050 | -0.72 | -720 | 61 | 86 |
| 2006 | 1025 | -0.17 | -170 | 975 | 0.23 | 230 | 68 | 86 |
| 2007 | 1000 | 0.15 | 150 | 930 | 0.48 | 480 | 72 | 87 |
| 2008 | 920 | 0.8 | 800 | 800 | 0.75 | 750 | 80 | 90 |
| 2009 | 1060 | -0.7 | -700 | 960 | -0.31 | -310 | 51 | 86 |
| 2010 | 1075 | -0.58 | -580 | 1000 | -0.12 | -120 | 55 | 83 |
| 2011 | 1100 | -0.72 | -720 | 1025 | -0.55 | -550 | 47 | 82 |
| 2012 | 980 | 0.45 | 450 | 860 | 1.04 | 1040 | 82 | |
| 2013 | 1110 | -0.75 | -750 | 1000 | -0.18 | -180 | 50 | |
| 2014 | 1200 | -1.825 | -1825 | 1100 | -0.61 | -600 | 3 | |
| 2015 | 1300 | -2.275 | -2275 | 1170 | -0.86 | -860 | 2 |
Table 3: Mean annual balance of Lemon Creek Glacier and Taku Glacier, the annual ELA and the cumulative annual balance in meters of we.
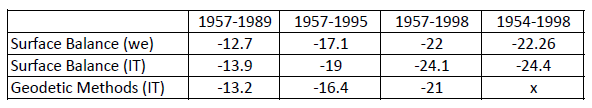 Table 4: A comparison of changes in net balance in water equivalent, net balance in ice thickness (IT), and glacier surface change measured directly using geodetic methods (IT).
References
Bazhev, A.B., 1986: Infiltration of meltwater on temperate and cold glaciers.
Materialy Glyatsiologicheskikh Issedoveiy-Kronika. Obuzhdeniya, 58: 50-56.
Heusser, C.E. and Marcus, M.G., 1964: Surface movement, hydrological change and
equilibrium flow on Lemon Creek Glacier, Alaska. J of Glaicol., 5(37): 61-75.
Krimmel, R.M., 1994: Runoff, Precipitation, mass balance, and ice velocity
measurements at South Cascade Glacier, Washington, 1993 balance year.
USGS OFR-94-4139.
LaChapelle, E.R., 1954: Snow studies on the Juneau Icefield. Amer. Geogr. Soc.
JIRP Report no. 9.
Marcus, M.G., Chambers, F.B., Miller, M.M. and Lang, M., 1995: Recent trends in
The Lemon Creek Glacier, Alaska. Phys. Geogr., 16(2): 150-161.
March, R.S. and Trabant D.C., 1995: Mass balance, Meteorological, Ice Motion,
Surface Altitude and Runoff Data at Gulkana Glacier, Alaska, 1992 Balance
Year. USGS WRI-95-4277.
Miller, M.M., 1955. A nomenclature for certain englacial structures. Acta
Geographica. 14 (17), 291-299
Miller, M.M., 1972: A principles study of factors affecting the hydrological balance
of the Lemon Glacier systems and adjacent sectors of the Juneau Icefield, SE
Alaska, 1965-1969. Institute of Water Research, Michigan State University, no. 33.
Pelto, M.S. and Miller, M.M., 1990: Mass balance of the Taku Glacier, Alaska from
1946-1986. Northwest Science, 64: 121-130.
Sapiano, J.J., Harrison, W.D. and Echelmeyer, K.A. 1998. Elevation, volume and
terminus changes of nine glaciers in North America. J. of Glaciol. 44(146):
119-135.
Thiel. E., Lachappelle, E. and Behrendts, J., 1957: The thickness of Lemon Creek
Glacier, Alaska as determined by gravity measurements. Transactions Amer.
Geophy. Union, 38 (5): 745-749.
Trabant, D.C. and Mayo, L.R., 1985: Estimation of internal accumulation on five
glaciers in Alaska. Ann. of Glaciology, 6, 113-117.
Walters, R.A. and Meier, M.F., 1989: Variability of glacier mass balances in Western
North America. In Peterson, D.H., Aspects of climate variability in the
Pacific and western Americas. AGU, Geophysical Mono. 55: 365-374.