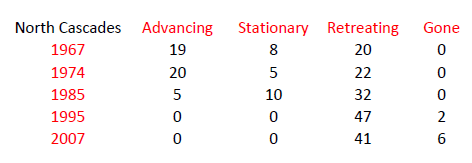
North Cascade glacier retreat is rapid and ubiquitous. All 47 monitored glaciers are currently undergoing a significant retreat or have disappeared in the case of six of them Lyall Glacier, Lewis Glacier, Spider Glacier, Milk Lake Glacier, Mt. David Glacier and North Arm Whitechuck Glacier have disappeared (Right). This retreat on eight Mount Baker glaciers from 1984-2005, each was advancing in 1975, averaged 340 m. The data indicate broad regional continuity in glacial response to climate. The rate of retreat increased from 1992-1998, 2003-2006 and 2014-2017. On each glacier the terminus location is surveyed from a fixed benchmark location beyond the terminus. The terminus is also located utilizing differential GPS to determine location to within a few feet. Glaciers are not just retreating at the terminus, lateral and even retreat at the head of the glacier can also be substantial.
Glacier Disequilibrium
There is no evidence that North Cascade glaciers are close to equilibrium. Mass balance has continued to decline even as the glaciers have retreated. Their ongoing thinning indicates that all of the glaciers will continue to retreat in the foreseeable future. In cases where the thinning is substantial along the entire length of the glacier, even in the accumulation zone than no point of equilibrium can be achieved with present climate and the glacier is unlikely to survive. This is the case on 9 of 12 glaciers where we have mapped the changes in glacier thickness. Foss Glacier, Mount Hinman and Ice Worm Glacier, Mount Daniels are two examples of endangered glaciers. The primary glaciers of Mount Baker can all retreat to a new point of equilibrium with current climate. Glaciers that will not survive are identified by the retreat of their margins in their upper regions and new rock outcrops in these areas. This is supposed to be the accumulation zone and thinning should not be occurring
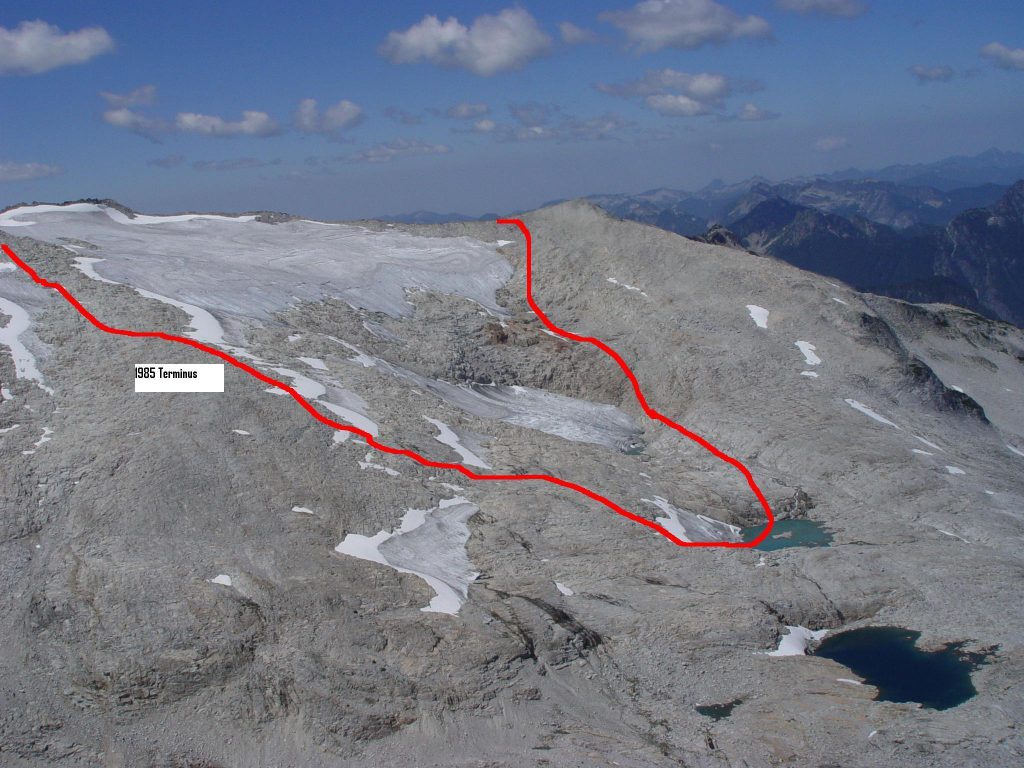
Terminus of Lyman Glacier. The lake beyond the glacier began to form in 1940. The terminus has retreated at a rate of 10 m/a since then. The area where vegetation becomes dominant is the 1890 trimline.
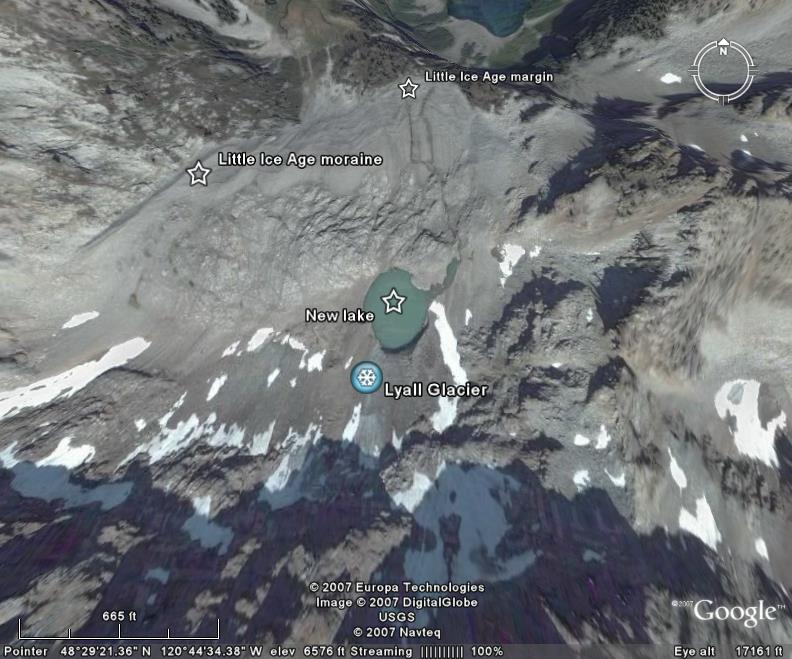
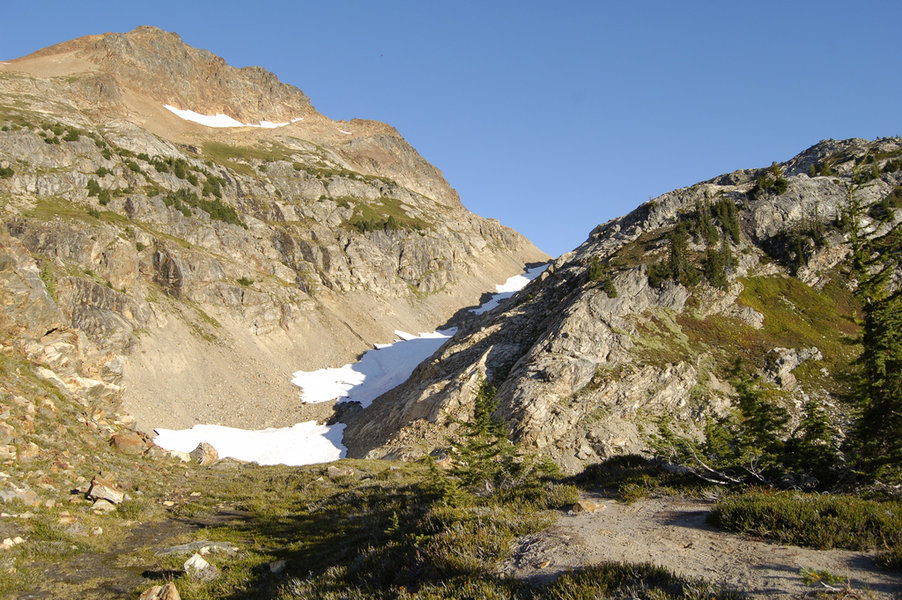
Above former Lyall glacier from Google Earth Image of 2005.
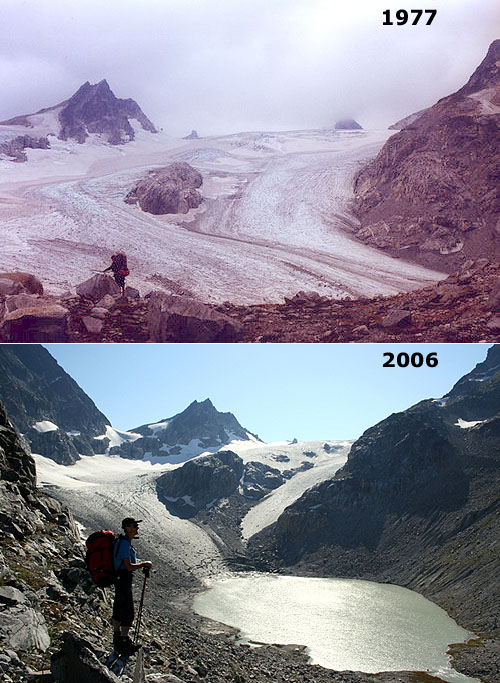
At left Honeycomb Glacier in 1977 (Bill Arundell) and 2006 (Lowell Skoog)

This rapid glacier retreat is evident in the reduced stream flow and increased runoff in the area. In the long run glacial retreat causes less runoff to be available which in turn reduces overall water supply. The recent change in climate is directly effecting the glaciers. The increases in temperature is causing the retreat of the glaciers to increase at a rate that is effecting the streamflow and runoff in the area. Data of specific retreat is shown below. The Lewis Glacier at left melted completely in 1993.
Different glaciers respond at various rates depending on their characteristics. This is evident in the differing behavior during this century. With three different glacier types.1) Retreat from the Little Ice Age (LIA) to approximately 1950 followed by a period of advance from 1950-1976, and then retreat since 1976. 2) Rapid retreat from the LIA to approximately 1950, slow retreat or equilibrium from 1950-1976, and moderate to rapid retreat since 1976. 3) Continuous retreat from the LIA to the present. These types reflect different physical characteristics. Regardless of type all glaciers are now retreating.
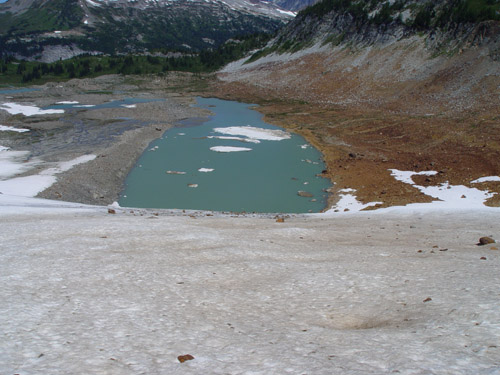
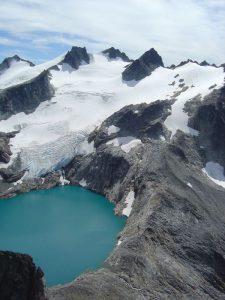
A glacier that illustrates the glacier retreat is the Lynch Glacier below which initially fills the lake basin in 1978, then retreats to the margin of the lake in 1985 and then retreats upslope from the lake by 2007.
Other glaciers have fared even worse Whitechuck Glacier in particular has suffered, with the north half of the glacier completely melting away (see Death of a glacier). Variations in other specific glaciers are seen in the Changes in glaciers through time photographic series.
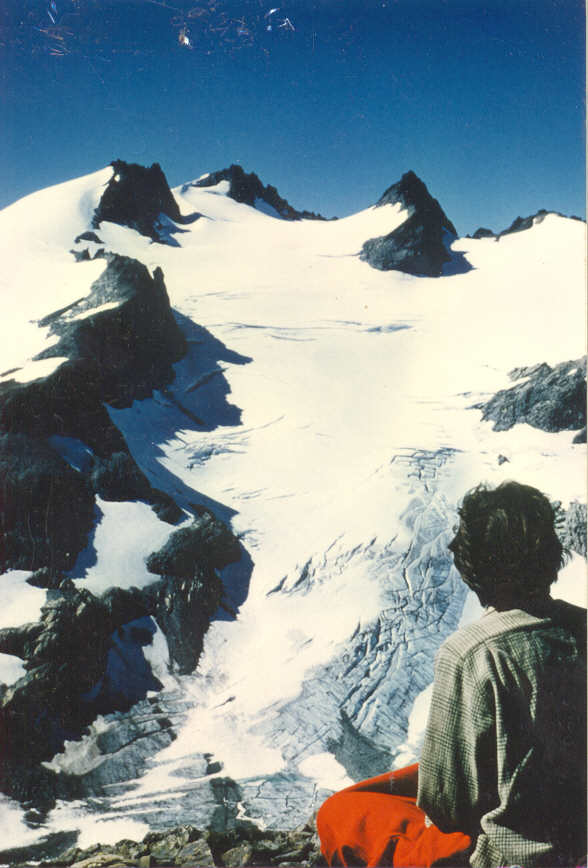
Left, Lynch Glacier in 1978 when it still filled Pea Soup Lake. Above, Lynch Glacier in 2007
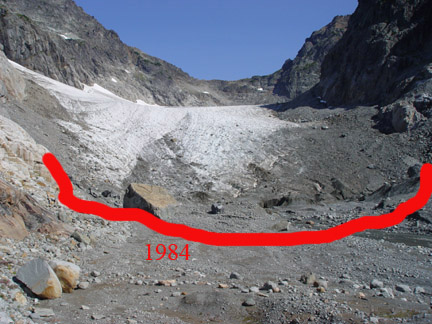
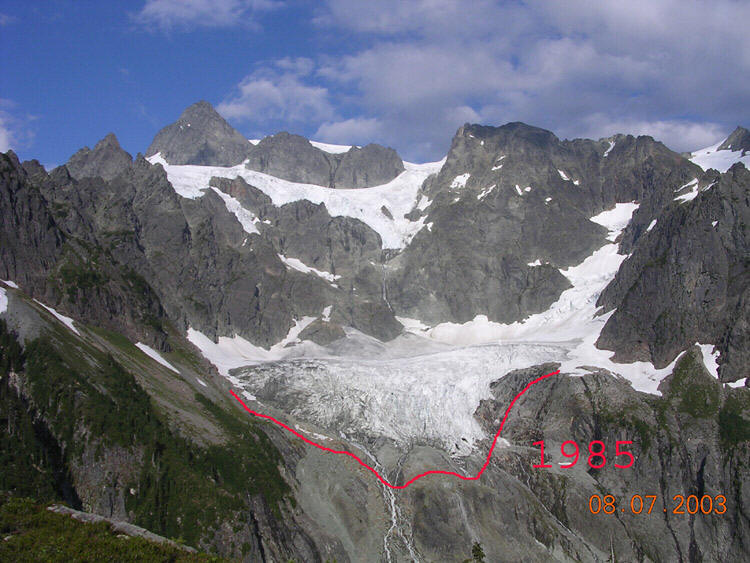
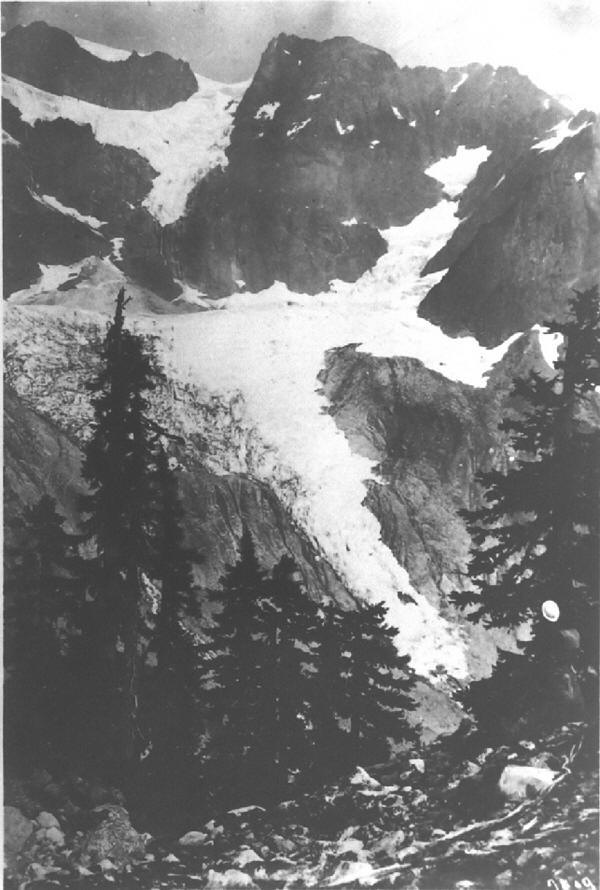
The Foss Glacier at left in 2005 with the 1985 margin illustrated in red. This glacier has lost half of its area in just 20 years, below is Foss Glacier in 1988
| TYPE 1 | 1850-1950 | 1950-1979 | 1980-2006 | Latitude | Longitude |
| Mazama | -2350 | 450 | –460 | 48 48 | 121 48 |
| Rainbow | -1370 | 512 | -410 | 48 48 | 121 46 |
| Easton | -2420 | 608 | –275 | 48 45 | 121 50 |
| Squak | -2500 | 305 | –265 | 48 45 | 121 49 |
| Talum | -1975 | 275 | -290 | 48 45 | 121 48 |
| Boulder | -2560 | 743 | -475 | 48 46 | 121 47 |
| Coleman | -2500 | 756 | -440 | 48 48 | 121 50 |
| Deming | -2200 | 628 | -350 | 48 45 | 121 51 |
| Ermine | -1800 | 170 | -330 | 48 09 | 121 07 |
| Dusty | -1800 | 280 | -350 | 48 07 | 121 06 |
| N. Guardian | -1550 | 160 | -17 5 | 48 07 | 121 05 |
| Kennedy | -1700 | 330 | -350 | 48 07 | 121 07 |
| Scimitar | -1600 | 350 | -320 | 48 08 | 121 07 |
| Ptarmigan | -1050 | 75 | -190 | 48 09 | 121 08 |
| Vista | -1900 | 105 | -160 | 48 09 | 121 07 |
| Quien Sabe | -1250 | 55 | -156 | 48 30 | 121 03 |
| Lower Curtis | -645 | 225 | -184 | 48 50 | 121 37 |
| Ladder Creek | -1230 | 105 | -165 | 48 39 | 121 09 |
| Sulphide | -1775 | 210 | -135 | 48 49 | 121 07 |
| TYPE 2 | |||||
| Cache Col | -360 | -25 | -72 | 48 22 | 121 03 |
| Columbia | -560 | -15 | -90 | 47 56 | 121 21 |
| Watson | -320 | -21 | -102 | 48 41 | 121 06 |
| Neve | -720 | -25 | -330 | 48 38 | 121 07 |
| Sahale | -260 | -12 | -62 | 48 49 | 121 02 |
| Sholes | -1170 | -57 | -85 | 48 49 | 121 46 |
| Yawning | -310 | 35 | -75 | 48 27 | 121 02 |
| Lynch | -60 | -390 | -123 | 47 34 | 121 11 |
| Ice Worm | -925 | 0 | -38 | 47 34 | 121 10 |
| Daniels | -960 | -20 | -410 | 47 34 | 121 10 |
| White River | -780 | -140 | -185 | 48 03 | 121 05 |
| Suiattle | -2400 | 15 | -175 | 48 04 | 121 05 |
| TYPE 3 | |||||
| Lewis | -65 | -80 | Gone | 48 31 | 120 48 |
| Colonial | -230 | -81 | -145 | 48 40 | 121 08 |
| Lyman | -1020 | -408 | -76 | 48 10 | 120 54 |
| Foss | -975 | -86 | -402 | 47 34 | 121 12 |
| Hinman | -410 | -300 | -243 | 47 35 | 121 14 |
| S. Cascade | -1800 | -350 | -160 | 48 21 | 121 03 |
| White Chuck | -1300 | -330 | -230 | 48 04 | 121 07 |
| Honeycomb | -1750 | -290 | -430 | 48 04 | 121 04 |
| Milk Lake | -400 | -190 | Gone | 48 10 | 121 11 |
| Lyall | -370 | -60 | Gone |
Table 2. Retreat in meters of North Cascade glaciers since the LIAM.