Impact Of Glacier Runoff On Baker Lake And The Baker River Project
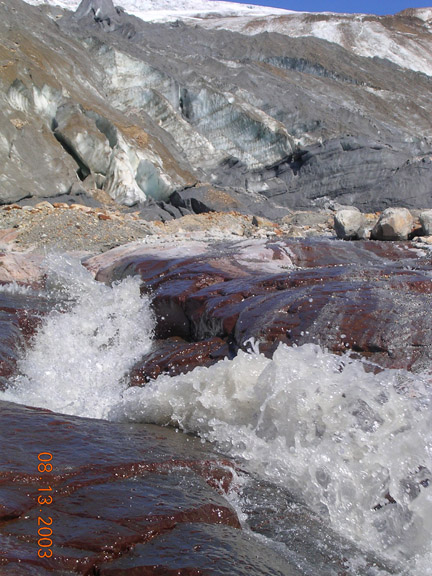
Runoff from Boulder Glacier in 2003.
The North Cascade Glacier Climate Project (NCGCP) has monitored North Cascade glaciers since 1983 to identify their response to climate change. Within the Baker Lake drainage, the Sulphide, Watson, Lower Curtis, Rainbow, Boulder, Squak and Easton Glacier have been monitored. Each summer both the accumulated snowmelt from the previous winter is measured and the total melting for the summer season. This yields the annual mass balance of the glacier (Pelto, 1988; 1996, Pelto and Riedel, 2001, Pelto and Brown, 2012 and Pelto, 2018). In addition the changing area, terminus position and surface profile are mapped periodically determining the longer term response of the glacier to climate change.
On the Baker River there are two large hydropower projects that can generate 215 MW of electricity at the Upper and Lower Baker Dams. The Lower Baker Dam is located on the Baker River in Concrete, Washington. It is 87 m tall and the reservoir capacity of Lake Shannon is 199,000,000 m3. Lake Shannon is 11 km long, covers acres at its full pool, and has an elevation of 134 m. The Upper Baker Dam is 95 m high and impounds Baker Lake. The lake has a normal full lake elevation of 221 m, an area of 19 km2 and a volume of 352,000,000 m3.
The glaciated area in the basin draining is 30 km2. On average from July 1-Oct. 1 the average glacier loses 2.7 meter of water equivalent thickness from melting. This represents 21-22 billion gallons of water. The flow in the Baker River in Concrete (USGS) yields 137 billion gallons during this period. Glacier runoff then represents 16% of the total flow during this period, peaking at 24% in August. However, the contribution is larger during dry summers and is higher for Baker Lake, which is a smaller basin area. In fact in a dry year such as 2015 glaciers yielded 32 billion gallons of runoff to Baker Lake, while other sources were below average, which amounted to 50% of the total basin flow. The melt rate is determined from repeat probing and stakes drilled into the glacier recording the actual surface melt.
As a glacier retreats its area available for melting declines and so does glacier runoff in the summer. During the early portion of the melt season May and June, glaciers store meltwater in their thick snow and firnpack, thus reducing the magnitude of high spring flows. As they retreat this ability declines. Thus, glacier retreat leads to an increase in spring runoff and a decline in summer runoff.
Glaciers are natural reservoirs that yield their resource primarily on warm dry summer days when other sources are at their lowest yield. This natural tempering of drought conditions will be reduced.
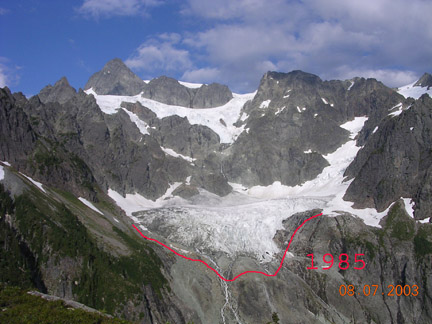
What happens when a glacier melts away? Changes occurring due to glacier retreat have been observed in the Lewis Glacier Basin. The Lewis Glacier Basin had a total area of 0.2 km2, comprised of steep bedrock and ice covered areas in 1985. By 1990, the former ice-covered areas were exposed gravels and boulders. In August 1985, Lewis Glacier had an area of 0.09 km2 and released 0.15 x 10⁶ m3 of runoff. By August 1990, Lewis Glacier had disappeared, runoff from the former glacier basin was 0.04 x 10⁶ m3, only 27% of the glaciated flow, despite the presence of some relict glacier ice, and that total monthly precipitation was the same.
In addition to the measured retreat we have measured the surface profiles of these glaciers, measured annual snowpack on the glaciers and annual ablation. Glaciers are critical to the water balance of Baker Lake in late summer. USDA’s Snotel sites provide a good measure of low elevation snowfall and consequent snowmelt in May and June, but they have no sites in the area that retain snow into July. Thus, we need to continue to monitor glacier ablation.
2003 Deming Glacier-Bellingham Water Supply Study
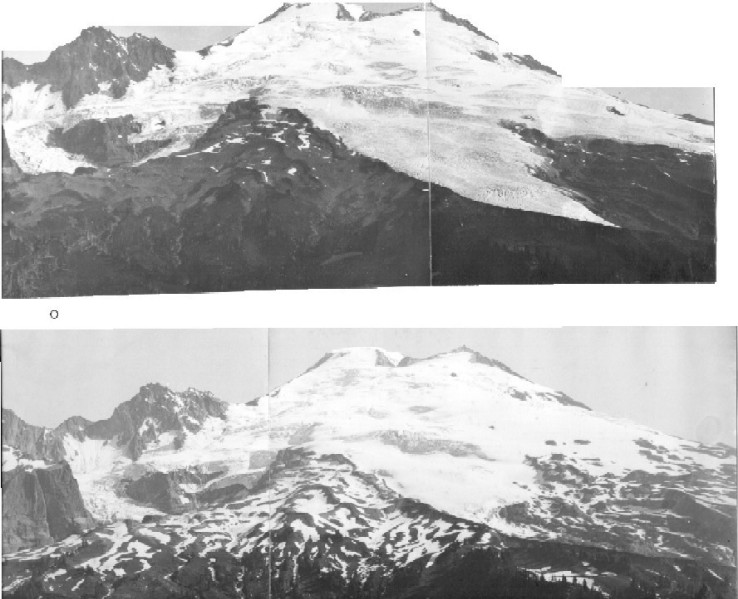
Easton Glacier in 1916.
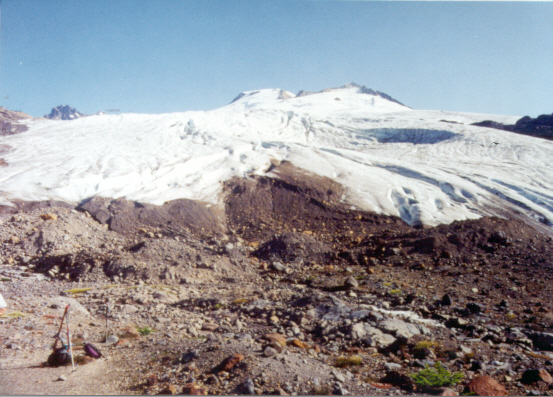
Easton Glacier from base camp in 1998
Easton Glacier in 1999
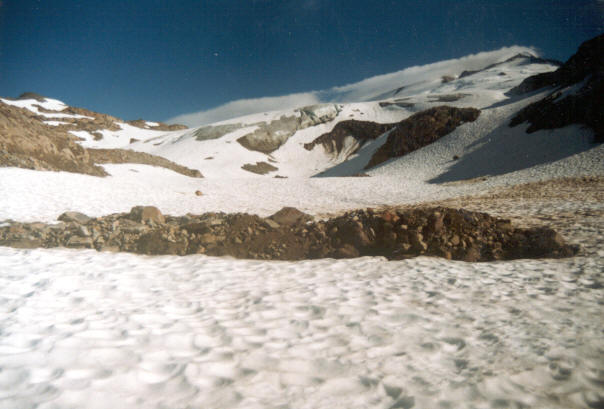
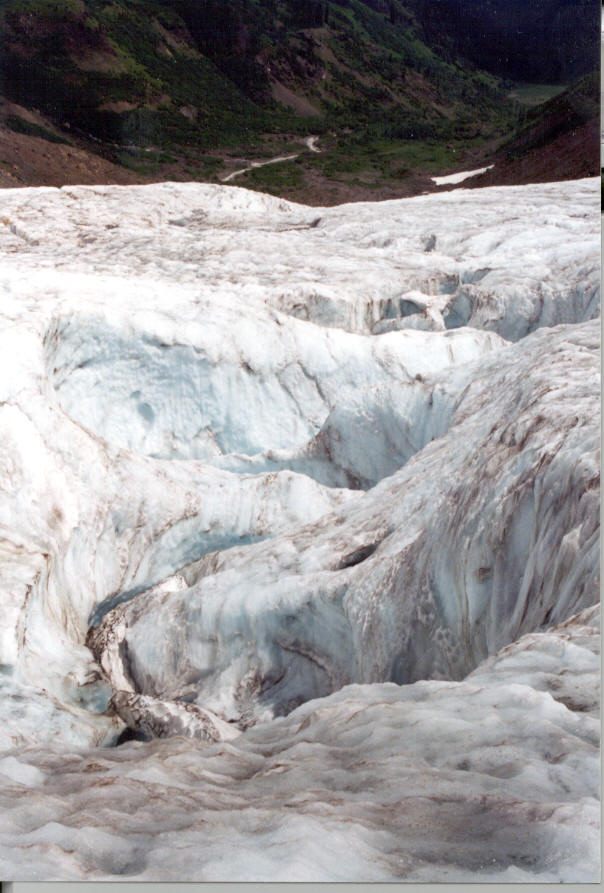 Rainbow Glacier surfacial glacial stream
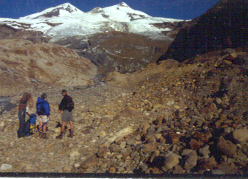 Boulder Glacier in 1993
References
1988: Annual balance of North Cascade glaciers, Washington, measured and predicted using an activity- index method. Journal of Glaciology, 34, 194-200.
Glacier runoff into Baker Lake, Washington. EOS, April 23, 1991, 130.
1993: Current Behavior of Glaciers in the North Cascades and Effect on Regional Water Supplies. Washington Geology, 21(2), 3-10.
1996, Annual Net Balance of North Cascade Glaciers, 1984-1994. Journal of Glaciology, 42(140) 3-9.
1996, Changes in Glacier and Alpine Runoff in the North Cascade Range, Washington USA 1985-1993.
Hydrological Processes, 10, 1173-1180.
2001: with Jon Riedel. The spatial and temporal variation of mass balance on North Cascade glaciers., Hydrological Processes.
2012: With Courtenay Brown. Mass balance loss of Mount Baker, Washington glaciers 1990–2010. Proc., 2012, 26(17), 2601–2607.
2018: How Unusual Was 2015 in the 1984–2015 Period of the North Cascade Glacier Annual Mass Balance? Water 2018, 10, 543.