What is mass balance?
Crucial to the survival of a glacier is its mass balance, the difference between accumulation and ablation (melting and sublimation). Climate change may cause variations in both temperature and snowfall, causing changes in mass balance. Changes in mass balance control a glacier’s long term behavior. It is the most sensitive climate indicator on a glacier. A glacier with a sustained negative balance is out of equilibrium and will retreat. A glacier with a sustained positive balance is out of equilibrium and will advance. if the sustained negative balance does not lead towards equilibrium the glacier is in disequilibrium.
What has research proven?
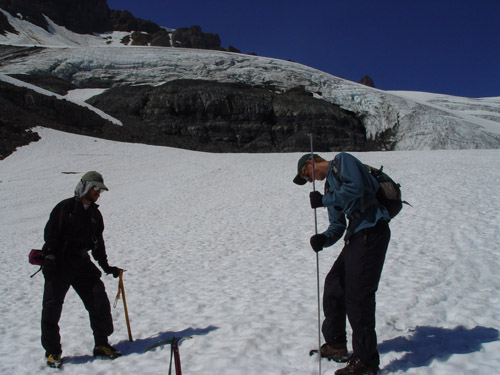
We have measured the mass balance on ten glaciers in the North Cascades each year since 1984. The cumulative mass loss has been substantial. Annual mass balance is the most sensitive annual glacier climate indicator. The mean Ba has been -0.55 m water equivalent per year ( m w.e.a-1) for the 1984-2022 period on the glaciers monitored annually, ranging from a maximum of -0.44 m w.e.a-1 to a minimum of -0.88 m w.e.a-1. The mean Ba, -0.54 m w.e.a-1 for North Cascade glaciers during the 1984-2022 period is quite similar to the WGMS global reference glacier mean Ba of 0.56 ma-1. The mean cumulative mass balance loss has been -24.6 m w.e., which is a 26-27 m of glacier thickness lost. The mean thickness of the several glaciers investigated by geophysical methods ranges from 30-70 m, each glacier observed was larger than the mean of North Cascade glaciers or the mean of glaciers observed by NCGCP. Thus, at least 30% of the volume of these glaciers has been lost since 1984 (Pelto, 2018).
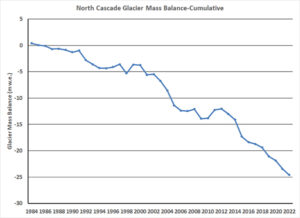
The annual glacier mass balance record below indicates that the response of annual balance is quite similar for each glacier. This demonstrates that it is regional climate changes from year to year that control glacier mass balance, not local microclimates. The cause of the negative mass balances has primarily been temperature rise. Precipitation has increased during the last 35 years. However, snowpack has not indicating more winter rain and melt events.
The data indicate broad regional continuity in glacial response to climate. Cross correlation values of annual balance between glaciers ranged from 0.73 to 0.98. The record reflects less variability and a more negative trend from 1984-1995. From 1996-2012, there was increasing inter-annual variability with alternately extreme positive and negative years, with a dominantly negative trend. From 2013-2022 strong negative balances have prevailed. The annual balance of individual glacier is in a Table below The chart at right shows the annual balance of each glacier and how they are closely correlated, following the same trend from year to year, but do have a significant range in annual balance during each given year.
Mass balance data record reported to World Glacier Monitoring Service:
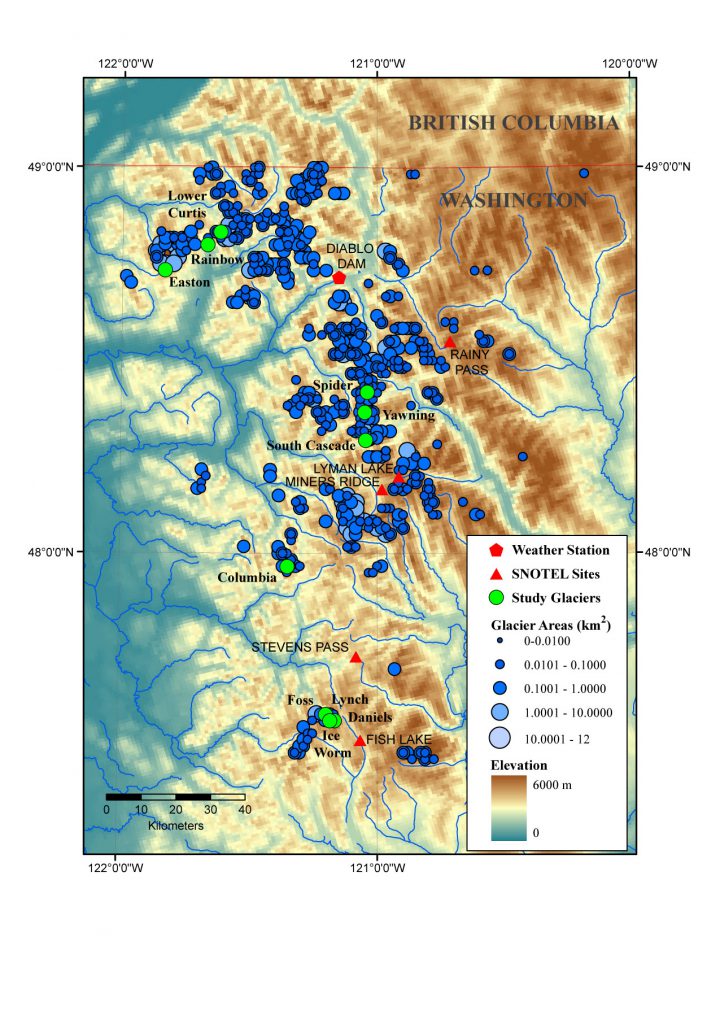
Map of North Cascade glaciers and glaciers studied.
| Year | Columbia | Daniels | Easton | Ice Worm | L.Curtis | Lynch | Rainbow | Sholes |
| 1984 | 210 | 110 | 860 | 390 | 330 | 580 | ||
| 1985 | -310 | -510 | -750 | -160 | -220 | 40 | ||
| 1986 | -200 | -360 | -450 | -220 | -70 | 200 | ||
| 1987 | -630 | -870 | -1390 | -560 | -300 | -260 | ||
| 1988 | 140 | -150 | -240 | -60 | 170 | 430 | ||
| 1989 | -90 | -370 | -670 | -290 | 30 | -240 | ||
| 1990 | -60 | -680 | -580 | -920 | -510 | -120 | -460 | -320 |
| 1991 | 380 | -70 | 410 | 630 | 40 | 360 | 440 | 480 |
| 1992 | -1850 | -1700 | -1670 | -2230 | -1760 | -1380 | -1650 | -1880 |
| 1993 | -900 | -830 | -1010 | -1020 | -480 | -620 | -800 | -960 |
| 1994 | -960 | -450 | -920 | -1230 | -550 | -400 | -720 | -880 |
| 1995 | -450 | 240 | -310 | 470 | -210 | 180 | -200 | -250 |
| 1996 | -620 | 450 | 220 | 570 | -180 | 530 | 120 | 60 |
| 1997 | 350 | 880 | 530 | 760 | 270 | 620 | 510 | 420 |
| 1998 | -1460 | -1820 | -1870 | -1640 | -1380 | -1970 | -1490 | -1560 |
| 1999 | 1750 | 1520 | 1610 | 2150 | 1550 | 1450 | 1840 | 1760 |
| 2000 | 400 | -250 | -100 | -330 | -250 | -240 | 150 | -80 |
| 2001 | -1520 | -1750 | -1930 | -2150 | -1880 | -1820 | -1710 | -1830 |
| 2002 | 600 | -180 | 180 | 50 | 130 | -130 | 120 | 210 |
| 2003 | -1170 | -1520 | -980 | -1400 | -1250 | -1200 | -980 | -1120 |
| 2004 | -1830 | -2130 | -1060 | -2000 | -1510 | -1980 | -1670 | -1860 |
| 2005 | -3210 | -2900 | -2450 | -2850 | -2750 | -2620 | -2650 | -2840 |
| 2006 | -980 | -1250 | -790 | -1350 | -1060 | -1050 | -610 | -710 |
| 2007 | -370 | 120 | 260 | -620 | -400 | 70 | 200 | 290 |
| 2008 | 940 | 410 | 450 | -100 | 120 | 510 | 650 | 200 |
| 2009 | -900 | -1350 | -2060 | -1560 | -2150 | -1820 | -1980 | -2680 |
| 2010 | -210 | -260 | 680 | -380 | -440 | -340 | 760 | 940 |
| 2011 | 1470 | 1060 | 1150 | 1340 | 940 | 980 | 1640 | 1450 |
| 2012 | 380 | 750 | -160 | 150 | -380 | 510 | 420 | 340 |
| 2013 | -780 | -150 | -1580 | -700 | -850 | -400 | -1850 | -1700 |
| 2014 | -500 | -550 | -1300 | -320 | -1350 | -850 | -1940 | -1530 |
| 2015 | -3480 | -3080 | -2780 | -3250 | -3400 | -2850 | -3450 | -3050 |
| 2016 | -1180 | -640 | -820 | -780 | -1550 | -1420 | -880 | -1520 |
| 2017 | -750 | -540 | -260 | -570 | -650 | -320 | 510 | 120 |
| 2018 | -630 | -680 | -500 | -750 | -820 | -640 | -530 | -820 |
| 2019 | -1870 | -1650 | -1700 | -2050 | -1440 | -1700 | -1180 | -1970 |
| 2020 | -892 | -380 | -633 | -620 | -810 | -580 | -441 | -1960 |
| 2021 | -870 | -2150 | -1560 | -1450 | -1480 | -2260 | -950 | -1720 |
| 2022 | -860 | -1180 | -1220 | -1260 | -720 | -1360 | -750 | -1810 |
| 2023 | -2650 | -3200 | -1750 | -3450 | -2360 | -2720 | -1513 | -2350 |
| Mean | -639 | -702 | -721 | -788 | -761 | -641 | -507 | -857 |
| Cumulative | -25562 | -28060 | -24503 | -31500 | -30420 | -25640 | -20294 | -29130 |
GlacierColumbiaDanielsEastonIce WormL. CurtisLynchRainbow SholesS. Cascade
| Columbia | 1.00 | 0.91 | 0.88 | 0.91 | 0.93 | 0.90 | 0.88 | 0.90 | 0.83 |
| Daniels | 0.88 | 0.95 | 0.91 | 0.97 | 0.85 | 0.89 | 0.86 | ||
| Easton | 0.90 | 0.93 | 0.91 | 0.96 | 0.95 | 0.89 | |||
| Ice Worm | 0.92 | 0.92 | 0.85 | 0.89 | 0.88 | ||||
| Lower Curtis | 0.94 | 0.93 | 0.93 | 0.82 | |||||
| Lynch | 0.88 | 0.93 | 0.81 | ||||||
| Rainbow | 0.94 | 0.80 | |||||||
| Sholes | 0.88 | ||||||||
| South Cascade | 1.00 |
Table 3. Cross-correlation of annual balance on North Cascade glaciers 1984-2023, except for Sholes Glacier and Easton Glacier 1990-2023. South Cascade Glacier observed by the USGS 1985-2022, all other glaciers data from NCGCP.
Detailed Reports on Glacier Mass Balance Include:
How Unusual Was 2015 in the 1984–2015 Period of the North Cascade Glacier Annual Mass Balance?-Water 2018, 10(5), 543; https://doi.org/10.3390/w10050543
Mass Balance loss on Mount Baker 1990-2010, 2012 in Hydrologic Processes Mauri Pelto and Courtenay Brown
Spatial and Temporal Variations in Annual Balance of North Cascade Glaciers, Washington 1984-2000 Mauri S. Pelto and Jon Riedel, Hydrologic Processes 15, 3461-3472, 2001