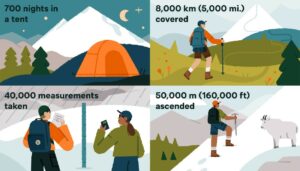
What it takes to monitor glaciers in the field for 40 years. (Megan Pelto Illustration)
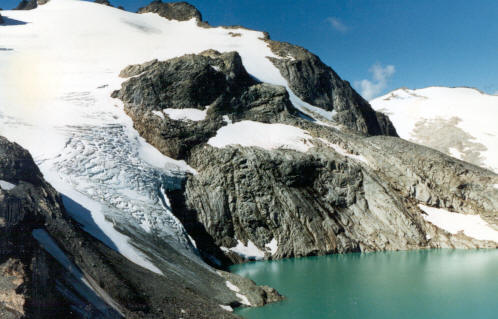
NCGCP began annual field monitoring in 1984 to identify and communicate the response of North Cascade glaciers to regional climate change. We are a fieldwork-based project with a focus on measuring changes in mass balance, glacier runoff, and terminus behavior. The project has an interdisciplinary scope — collaborating with a range of natural scientists, artists, journalists, and conservationists. The goal of this is to best document and share our research with a broad audience. We aim to bring stories of these places and their changes to as many people as we can, making our research feel personal to more than just our team. The North Cascades glaciers are important for the ecosystem, as a water resource to Washington, and as a place of recreation for so many. Our research has documented that North Cascade glaciers’ response to climate change has been a 25-30% volume loss from 1984-2022, with rapid retreat or disappearance of all 47 glaciers we have monitored. This rapid decline is important to understand, as North Cascade glaciers are a vital resource for rivers, ecosystems, and people.
By monitoring them every year, we continue to provide critical data on glacier response to climate change and informed stories of their health that reveal the impacts of our warming world. Due to climate change, the glaciers will continue to retreat in the foreseeable future. The reduction in area will continue to lead to declines in summer glacier runoff. Of the 47 glaciers we began monitoring 10 are now gone.
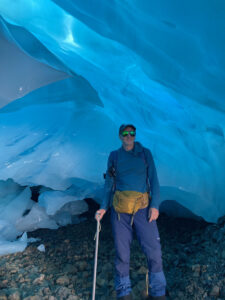
About Mauri S. Pelto-Science Director
Dr. Pelto has been a professor of environmental science at Nichols College and the director of the North Cascades Glacier Climate Project for 40.years. The science research team has recorded the mass balance of numerous glaciers, all of which are retreating due to global warming. Three of the glaciers are of the World Glacier Monitoring Service Reference glacier network. Climate change has raised temperatures; which in turn has increased melting and increased the frequency of winter rain and melt events that reduce winter accumulation on North Cascade glaciers. This has led to the retreat of all 47 glaciers we monitor, with ten of those glaciers having disappeared. The reduction in volume and area is reducing summer contributions to streamflow.
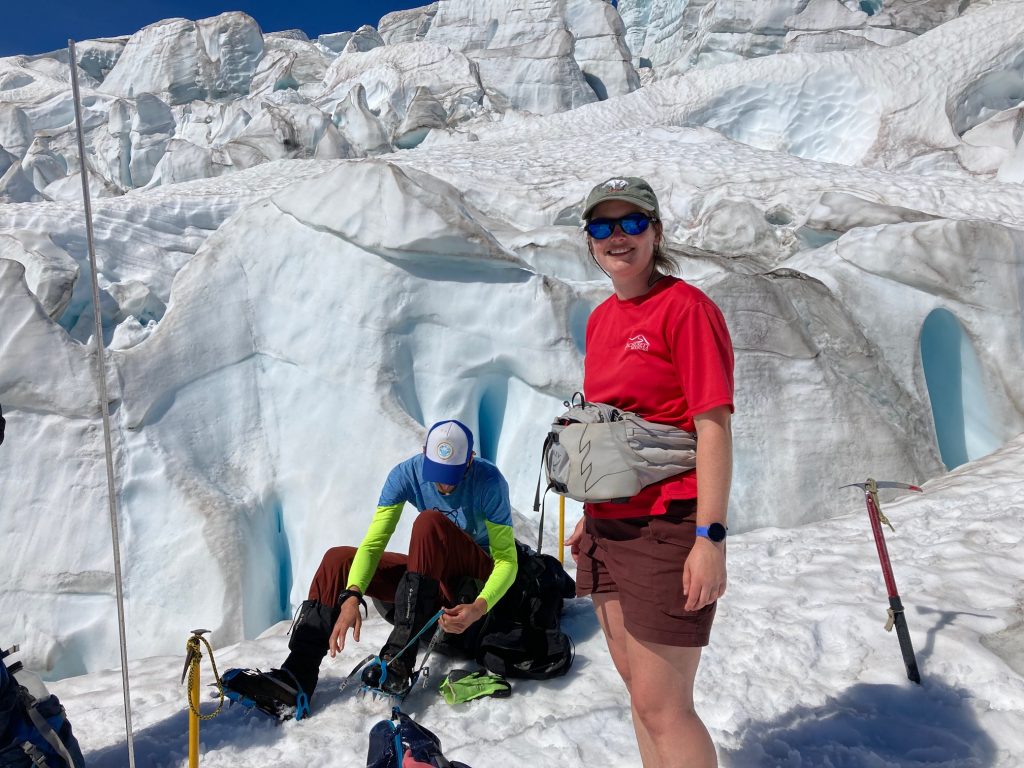
About Jill Pelto-Art Director
Jill Pelto has spent 15 years working with the project and is an artist and scientist from New England who grew up loving winter sports and trips to the mountains. She incorporates scientific research and data into paintings and prints to communicate environmental changes. Her multi-disciplinary work weaves visual narratives that reveal the reality of human impacts on this planet. She completed both her B.A. degrees in Studio Art and Earth and Climate Science and her M.S. focused on studying the stability of the Antarctic Ice Sheet at the University of Maine, spending two field seasons at a remote camp in the southern Transantarctic Mountains.. She is excited about continuing to document the change in North Cascade glaciers that she has witnessed each of the last fifteen years — through science and art.
Publications
NCGCP Publications downloadable
View Media Links
2023 Field Season
List of Disappearning Glaciers in Washington
Introduction to North Cascade Glaciers