Glaciers as Reservoirs:
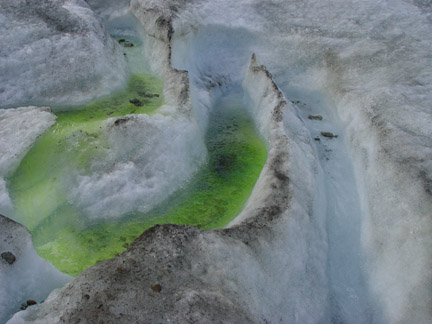 Measurements of glacier discharge are monitored on surface drainage basins on glaciers and beyond the terminus of glaciers. Dye is used to determine the velocity of the turbulent streams.
Glaciers act as natural reservoirs storing water in a frozen state instead of behind a dam. Glaciers modify streamflow releasing the most runoff during the warmest, driest periods when all other sources of water are at a minimum (Stenborg, 1970; Fountain and Tangborn, 1985). Below is a general description of glacier impacts on hydropower. At right is specific examples from around the globe. This seasonal variation characteristic mitigates low flow intervals and makes glacier runoff a valuable water resource for hydropower (Fountain and Tangborn, 1985). The amount of runoff provided by a glacier is the product of its surface area and ablation rate. Annual glacier runoff is highest in warm, dry summers and lowest during wet, cool summers, further providing a balance to summer runoff (Fountain and Tangborn, 1985; Hock et al., 2005). This has been referred to as the glacier compensation effect (Lang, 1986). Glacier runoff does not increase or decrease the long term runoff for a basin, total runoff over a period of several years is determined largely by annual precipitation. The loss of a glacier does not necessarily reduce annual runoff, annual precipitation changes are the key for annual runoff changes. Glacier runoff peaks at the height of the melt season July and August in the Northern Hemisphere, greatly enhancing summer runoff. Runoff from non-glacier alpine basins peaks in May and June (Figure 1). Unlike non-glacier runoff, glacier runoff correlates better with temperature than precipitation, due to the dominant role of glacier melt compared to precipitation in summer runoff from glacierized basins. This is also the reason for the strong diurnal nature of glacier runoff.
There are two changes in glacier runoff that occur as a result of warming and enhanced glacier melt. The initial response is an increase in glacier melt rate enhancing glacier runoff, while the glacier extent is still substantial in comparison to previous size. The initial enhancment of glacier runoff has been observed in several regions (Andreassen et. al., 2005; Braun et. al., 2000; Zhan et. al., 2008)). Eventually the resulting decline in glacier extent reduces the area available for melting causing a decrease in glacier runoff. In several basins a decline of more than 20% in glacier area has led to a decrease in glacier runoff (Pelto, 2008; Stahl and Moore, 2006). There is a threshold of glacier extent reduction dependent on the magnitude of ablation rate increase, where glacier runoff declines, the few examples suggest this is in the 10-20% areal extent loss. In the long run glacier retreat simply results in the reduction of runoff in the summer, when other runoff sources are also depleted. The increase in streamflow flow will be in the winter and spring when water supply is already high in most alpine regions. Examination of recent changes in glacier runoff indicate several frequent responses, highlighted by comparison of glaciated and unglaciated basins in North America (Fountain and Tangborn, 1985; Fleming, 2005; Pelto, 2008). A specific example is between neighboring basin unglaciated Newhalem Creek and Thunder Creek 14% glacier cover (Pelto, 2008) (Figure 2). Northwest Science Paper link.
1) Streamflow has risen 18% in Newhalem Creek and 19% in Thunder Creek despite only a slight increase, 2% in winter precipitation at Diablo Dam, within 5 km of both basins. Alpine runoff throughout the Pacific Northwest is increasing in the winter (Nov.-March), as more frequent rain on snow events enhance melting and reduce snow storage.
2) Spring runoff (April-June) has increased in both basins by 5-10% due to earlier alpine snowpack melting.
3) Summer runoff has decreased markedly, 27%, in the non-glacier Newhalem Basin with the earlier melt of reduced winter snowpack. In Thunder Basin runoff has in contrast decreased negligibly, 4%. The difference is accounted for in part by enhanced glacier melting. The observed net loss of -0.52 m/a in glacier mass spread over the melt season is equivalent to 2.45 m3/s in Thunder Basin, which is 10% of the mean summer streamflow.
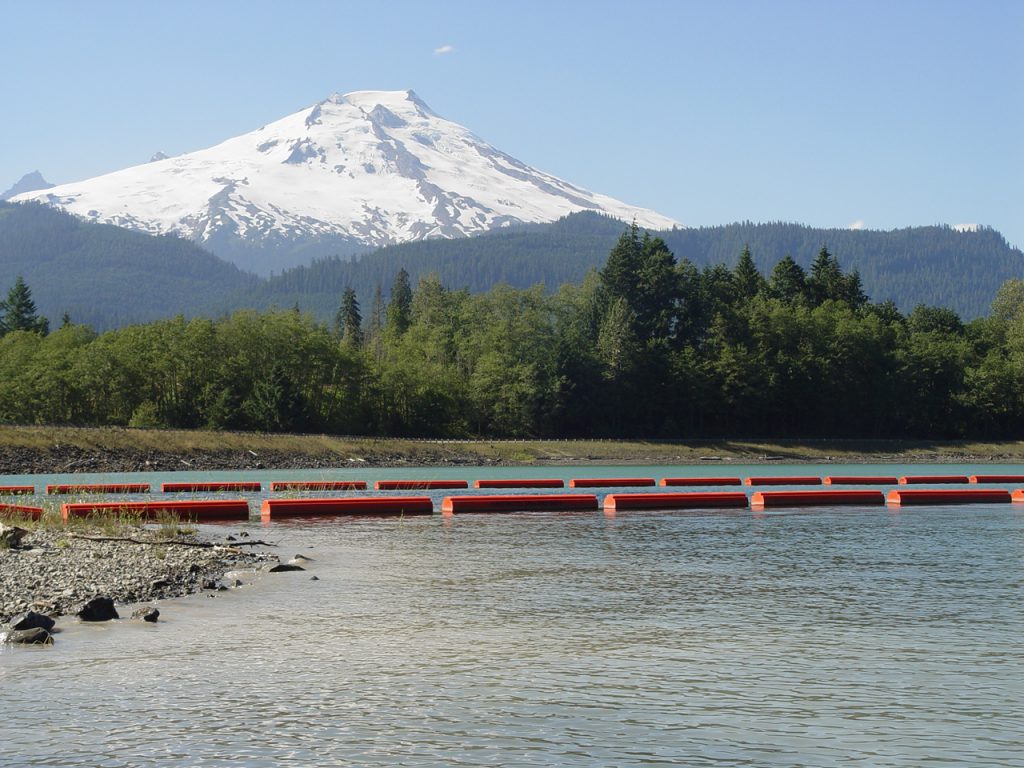 Figurer 4. View across Baker Lake impounded by Baker Dam to the glaciers on Mount Baker that feed this hydropower project
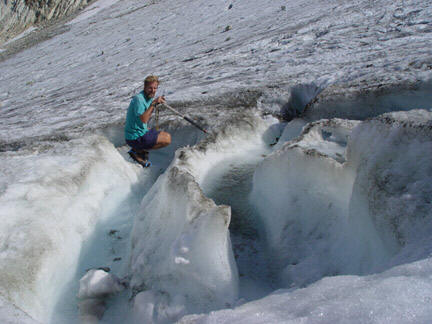
Selected Glacier Dependent Hydropower Projects
South America
A number of South American countries are highly dependent upon glaciers and glacial runoff for energy production. In the Andes region, hydropower supplies 81% of Peru’s electricity, 73% of Colombia’s, 72% of Ecuador’s, and 50% of Bolivia’s, in each country glaciers contribute a significant portion of this runoff. In the Cordillera Blanca, Peru glacial cover has been shrinking since the 70’s, decreasing by 15% over a 25 year span. In the Rio Santa Basin of Peru glacier runoff comprises 35% of the total runoff (Vergara et. al., 2008). The Canon del Plata hydropower project would experience a decrease from 1540 gigawatt-hours to 1250 gigawatt-hours for a 50% glacier runoff reduction and decline to 970 gigawatt-hours for a 100% glacier loss (Vergara et. al., 2008). The value of this energy lost would be $5.7 to $11.6 million. The Artesonraju Glacier is an example of how sought after the glacier runoff is. Pacific Hydro has recognized the potential of glacier fed alpine streams for hydropower in Chile and has built a facility on the glacier fed Cachapoal Rivers and is developing projects on the Tinguiririca River. The combination of snow melt, glacial melt and rainfall water sources provides for reliable runoff in these basins. A continuing trend in glacier loss will seriously decrease the water reserves stored as ice, reducing melt season runoff.
Asia
In India, 50% of hydroelectric power is generated by runoff from Himalayan glaciers. A key component of India’s energy self-sufficiency is more hydropower. Most of the hydropower is from northern India on streams draining Himalayan glaciers. The Alaknanda River headwater is the Satopanth and Bhagirath Kharak Glaciers. India has applied to the World Bank for run of river hydropower along this glacier fed river. In 2005 the Tehri Dam was finished on the Bhagirathi River, it is a 2400 mw facility that began producing hydropower in 2006.
The headwaters of the Bhagirathi River is the Gangotri and Khatling Glacier, Garhwal Himalaya. Gangotri Glacier has retreated 1 km in the last 30 years, and with an area of 286 km2 provides up to 190 m3/second (Singh et. al., 2006).
Nepal is beginning to turn to hydropower, with run of river hydropower development on the glacier fed Arun, Sun Koshi, Kali Gandaki and Mrysangdi Rivers opening in 2003. In China glaciers occupy a total area of 59,406 km2. Runoff from these glaciers yield some 60 billion m3 annually. On the Yangtze 14 additional dams to the Three Gorges project are proposed that would take advantage of the existing glacier runoff time and again. To date glacier runoff has increased due to increased melt (Zhang, et. al., 2008). Glacier runoff is forecast to decrease markedly as retreat progresses in China.
Pakistan generates about 45% of its electricity from hydropower on the Indus River. The headwaters of the Indus River are the large glaciers of the Karokoram Range. The Biafo and Baltura are two or the largest. Both glacier have experience rapid retreat and loss of area in the last two decades. The Indus River flows have also declined. Most of the rivers in Tajikistan originate from glaciers. On Vakhsh river, there are already five hydroelectric plants, among which is the largest in Central Asia – the Nurek hydroelectric power station, with a production of 3 million kilowatts (Normatov and Petrov, 2006). Glaciers provide about 13 km3 of water during the summer peak melt period as the Abramov and Fedchenko glacier are at the headwaters of the Vaksh River (Normatov and Petrov, 2006). Tajikistan is has plans to increase hydropower by several hundred percent, increasing the importance of glacier runoff.
Europe
Glacial runoff supplies hydropower for 50% of Switzerland’s electricity as well (Paul et al., 2007). In Switzerland, 84 out of 85 glaciers under observation became shorter in 2006 (WGMS, 2008). Between 1850 and 1973 Swiss glaciers lost 27% of their area. Based on satellite observation, a sample of 270 glaciers also lost 20% of their area between 1973 and 1998. This loss in melt extent is reducing glacier runoff and summer alpine streamflow. The Grand Dixence Dam is situated on the relatively small Dixence River, but collects a large amount of water thanks to a system of water supply tunnels over 100 km long bringing water from other rivers and valleys. Most of the water comes from glaciers providing meltwater during the summer. The lake is usually full of water by late September, and is emptied during the winter, reaching its lowest point by April.
Austria generates 70% of its electricity from hydropower, with many of the larger projects being glacier fed such as Kaprun. The Kaprun power station produces 700 MW, 60% of its water supply is from Pasteze Glacier, which is transferred through a 12 km long tunnel to Mooserboden Reservoir. Pasterze Glacier has been retreating at a rate of 51 m/a, which will reduce melt season runoff.
The Rhone River has 19 hydropower plants supplying 25% of France’s hydropower and 4% of the total energy supply. The Rhone River begins at the Rhone Glacier, Switzerland and is fed by the largest glacier in the Alps Gross Aletsch. The Rhone River is also fed by the glaciers of Mont Blanc and the Matterhorn region.
In Norway, 98 percent of the electricity comes from hydroelectric power, and 15 percent of the exploited water flow comes from glacier melt. Because a large share of the runoff in the glacial water systems comes from melting, most of this runoff, up to 80 %, takes place in the summer. In dry and warm summers, glacial melting helps maintain a substantial water flow. The summer of 2002 had unusually high temperatures resulting in unusually little water flow in rivers without glaciers in their catchment area. The high temperatures provided large amounts of runoff from the glaciers. In the Nigardsbreelva watershed in Jostedalen, where 75 percent of the catchment area is covered by glacier, water flow approached flood levels throughout much of August. In northern Norway, the Svartisen ice cap and smaller ice caps and glaciers in the same watershed cover about 50% of the drainage area that is utilised by the Svartisen hydropower plant in northern Norway (Andreasson et.al., 2005).
North America
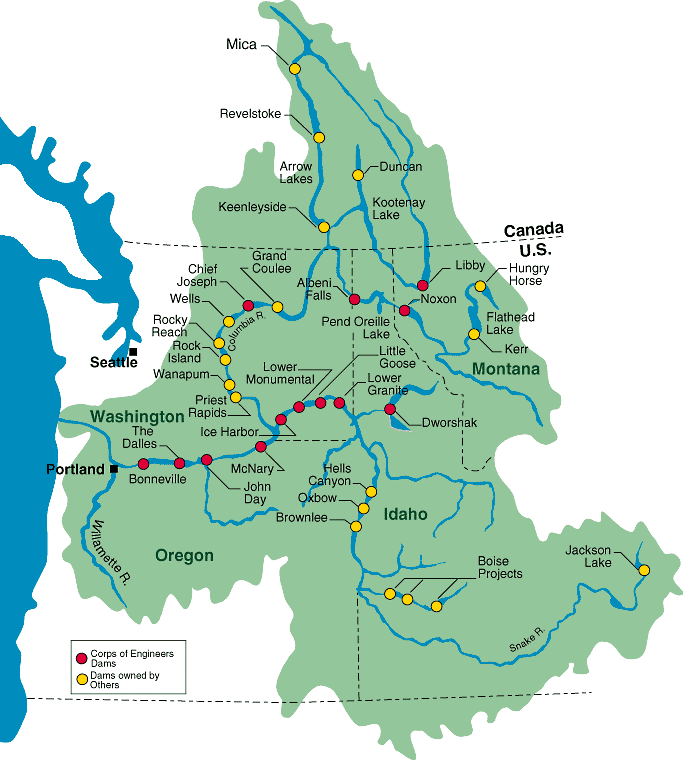
British Columbia, Canada hydropower accounts for approximately 90% of the electiricity. In dry years glacier runoff constitutes most of later summer inflows to several large reservoirs. In the Columbia River Basin 10-20% of annual flow and 50% of summer flow are from glaciers. In the Columbia River Basin, Mica, and Revelstoke hydroelectric plants are principally glacier fed (Fleming and Clarke, 2005) (Figure 2). Downstream of these stations are 14 additional dams on the Columbia River each tapping this same glacier runoff for hydropower. British Columbian rivers had a statistically significant decrease in August streamflow from 1976 to 1996, partly due to earlier snow melt (Stahl and Moore, 2006).
Volume loss of BC glaciers over the 1985-1999 was found to be occurring at a rate of 22.48±5.53 km3 per year. Covering an area of 30,000 km2 and 48% of BC’s gauged systems glacier-melt moderates inter-annual variability in streamflow and helps to maintain higher runoff volume in times of extreme warm and dry conditions. Glacier-melt also supports ecosystem functions by maintaining cooler water temperatures. However, a large majority of streams in glaciated basins in BC showed a statistically significant decrease in August streamflow during 1976 to 1996, which suggests that these glaciers even with increased melt rates are providing less runoff (Stahl and Moore, 2006).
North Cascades, Washington currently support approximately 700 glaciers. These glaciers store as much water as all of the states lakes, rivers, and reservoirs combined, and 25% of the North Cascade region’s total summer water supply. North Cascade Glaciers release approximately 230 billion gallons of water during the summer. This water is nearly fully utilized for irrigation, salmon fisheries and power generation. With recent warming in the area all 47 monitored glaciers have been retreating (Pelto and Hedlund, 2001). The loss in glacier volume in the last 25 years has been 20-40%. Many of these glaciers feed the Columbia River system, the rest Puget Sound.
In the Baker Lake Basin glaciers provide critical water runoff (Figure 3). The glaciated area in the basin draining is 29.8 km2. On average from July 1-Oct. 1 the average glacier loses 2.7 meter of water equivalent thickness from melting. This represents 80 million m3 of water. The flow in the Baker River in Concrete (USGS) yields 520 million m3 during this period. Glacier runoff then represents 16% of the total flow during this period, peaking at 24% in August. However, the contribution is larger during dry summers and is higher for Baker Lake, which is a smaller basin area. In fact in a dry year such as 1998 glaciers yielded 110 million m3 of runoff to Baker Lake, while other sources were below average, which amounted to 45% of the total basin flow (Pelto, 2008).
Conclusion
| It is apparent that the demand for hydropower is increasing. In alpine regions glaciers are an important contributor of runoff during the melt season when other water sources are at a minimum. As glacier area is lost there will be a long term decline in glacier runoff and alpine streamflow during the melt season. This will reduce the hydropower output during the melt season. |
References
| Andreassen, L.M., Elvehøy, H., Kjøllmoen, B Engeset. R. and Haakensen, N.,2005. Glacier mass balance and length variation in Norway. Annals of Glaciology, 42: 317-325.Bradley, R.S., Vuille,M., Diaz, H.F. and Vergara, W. 2005. Threats to Water Supplies in the Tropical Andes. Science, 312(5781): 1755 – 1756.
Braun, L. N., Weber, M., and Schulz, M., 2000. Consequences of climate change for runoff from Alpine regions. Annals of Glaciology, 31:19-25. Brugman, M.M., Raistrick, P. and Pietroniro, A., 1997. Glacier related impacts of doubling atmospheric carbon dioxide concentration on British Columbia and Yukon (Chapter 6). Environment Canada and BC Ministry of Environment, Lands, and Parks. Chen J., and Ohmura, A., 1990. On the infl uence of Alpine glaciers on runoff. In ”Hydrology ofmountainous regions I.” (H. Lang, and A. Musy, Eds.), Proceedings of two Lausanne Symposia, 1990, IAHS Publ. 193, 117-126. Collins, D. N., and Taylor, D. P., 1990. Variability of runoff from partially-glacierised Alpine basins. In ”Hydrology of mountainous regions I.” (H. Lang, and A. Musy, Eds.), Proceedings of two Lausanne Symposia, 1990, IAHS Publ. 193, 365-372. Moore, R.D., Fleming, S.W., Menounos, B., Wheate, R., Fountain, A., Stahl, K., Holm, K., and Jakob, M., 2009. Glacier Change in Western North America: Influences on Hydrology, Geomorphic Hazards and Water Quality. Hydrologic Processes, 23:42-61 Fleming, S. and Clark, G.K.C., 2005. Attenuation of high-frequency interannual streamflow variability by watershed glacial cover. ASCE Journal of Hydraulic Engineering, 131: 615-618. Fleming, S.W., 2005. Comparative analysis of glacial and nival streamflow regimes with implications for biotic habitat quantity and fish species richness. River Research and Applications, 21: 363-379. Fountain, A.G., Tangborn, W.V., 1985. The Effect of Glaciers on Streamflow Variations. Water Resources Research, 21: 579-586. Hock, R., Jansson, P, and Braun, L. 2005. Modelling the Response of Mountain Glacier Discharge to Climate Warming. In: Huber, U., Bugmann, M. and Reasoner, M. (Eds) Global Change and Mountain Regions, Springer, Dordrecht. p.243-252. Hopkinson C., and Young, G., 1998. The effect of glacier wastage on the flow of the Bow river at Banff,Alberta, 1951-1993. Hydrological Processes 12: 1745-1762. Normatov, I., and Petrov, G., 2006. Reservoirs and their role in social and economical development in Tajikistan and Central Asia. In Dams and Reservoirs, Societies and Environment in the 21stCentury. Taylor Francis Books, London, UK. Paul, F., Kääb, A. and Haeberli, W. 2007. Recent glacier changes in the Alps observed by satellite: Consequences for future monitoring strategies. Global and Planetary Change, 56, 102-111. Pelto, M.S., 2008. Impact of Climate Change on North Cascade Alpine Glaciers, and Alpine Runoff. Northwest Science, 82: 65-75. Pelto, M.S. and Hedlund, C.,2001. The terminus behavior and response time of North Cascade glaciers. Journal of Glaciology, 47: 497-506 Singh, P., Haritashya, U., Kumar, N., and Singh, Y., 2006. Hydrological characteristics of the Gangotri Glacier, central Himalayas, India.Journal of Hydrology, 327: 55-67. Stahl, K. and Moore. R., 2006. Influence of watershed glacier coverage on summer streamflow in British Columbia, Canada. Water Resources Research 42: W06201, doi:10.1029/2006WR005022 Stenborg, T. (1970). Delay of runoff from a glacier basin. Geografi ska Annaler 52A, 1-30. Vergara, W., Deeb, A., Valencia, A., Bradley, R., Francou, B., Zarzar, A.,GrÜnwaldt, A., and Haeussling, S., 2008. Economic Impact of rapid glacier retreat in the Andes. EOS, 88(25): 261-262. WGMS. 2007. Glacier Mass Balance Bulletin No. 9 (2004-2005). Haeberli, W., Zemp, M. and Hoelzle, M. (eds.), (World Glacier Monitoring Service, Zurich, Switzerland) WGMS. 2008. Global Glacier Changes: facts and figures. Zemp, M., Roer, I., Kääb, A., Hoelzle, M., Paul, F. and Haeberli, W. (eds.), (World Glacier Monitoring Service, Zurich, Switzerland) Zhang, Y., Liu S., Xu, J., and Shangguan D., 2008. Glacier change and glacier runoff variation in the Tuotuo River basin, the source region of Yangtze River in western China. Environmental Geology, 56: 59-68. |